Using Delta-e metrics we estimate the difference between two colors, i.e. the difference between a sample color, taken from our image, and a reference color taken from a document (reference document in CGATS format) that describes the colorimetry of our color chart.
In this way, after photographing a color chart, with its colorimetry known as a Colorchecker family chart, and subjecting it to a particular workflow, we can easily estimate the color difference between the reality and its digital representation.
The implemented metrics are:
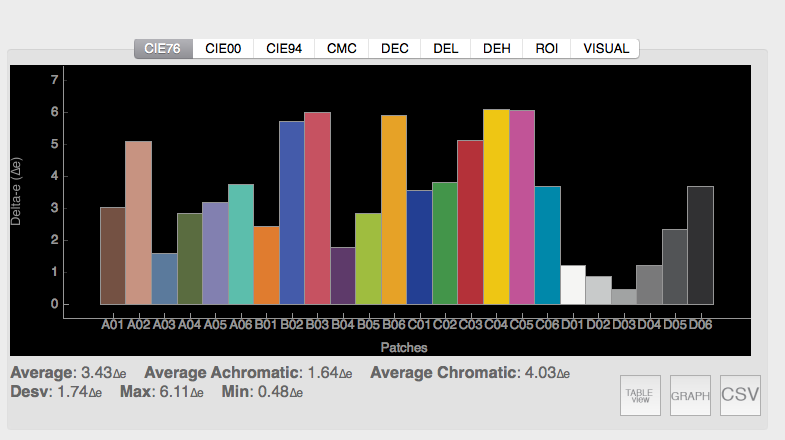
- CIE76: which is the oldest metric, but at the same time the most used in a multitude of standards and recommendations
- CIE00: o CIE 2000 is the most up-to-date version of the estimation of the difference between colours, with the difference from CIE 76 being perceptually uniform, i.e. the differences are estimated on the basis of human perception rather than mere Euclidean distance as in CIE76
- CIE96: is a disused metric, resulting from the evolution towards a perceptually uniform metric that was left behind by the ICD00 proposal
- CMC: is a metric of the Color Measurement Committee related to the world of printing and textile inks. It is the first perceptually uniform metric, but has only been used in the field of the textile industry.
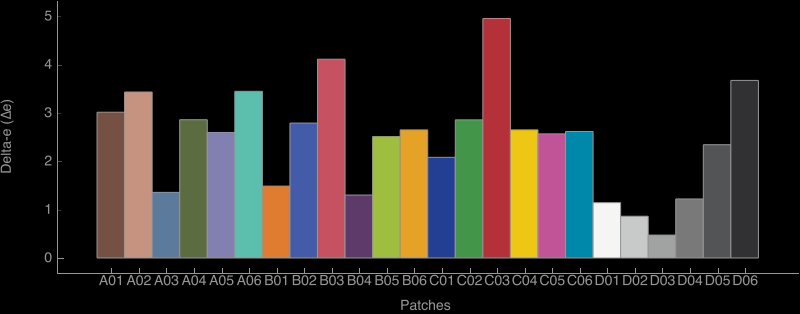
- DEC (Delta Chroma) where the error in chromaticity is expressed
- DEL (Delta Lightness) where the clarity error is expressed
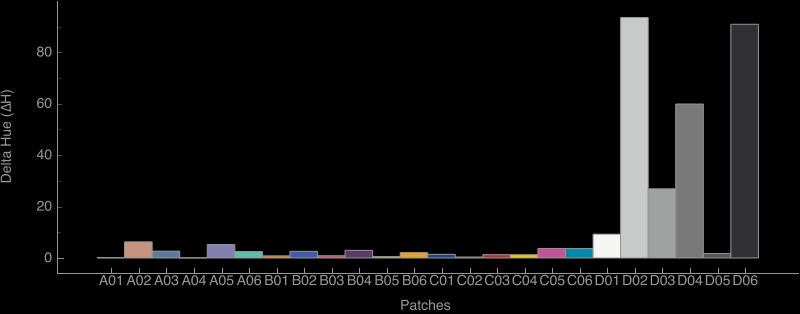
- DEH (Delta Hue) where the shade error is expressed
- Average: or average error, where the errors of all the patches are averaged
- Average Achromatic and Average Chromatic: here the error is separated between chromatic patches (patches with a color shade, and achromatic or neutral patches. This is necessary because often neutral patches accumulate less error, and cause the Delta-e average to drop, offering unrealistic error averages with color deviation for samples with a certain chromaticity.
- Max and Min: show the maximum and minimum error. In particular, the maximum error must be taken into account, since if our works have a shade close to the samples that accumulate more error, our average will not be representative of the quality of the resulting work.
- ROI (Region Of Interest) leaves testimony where the samples have been taken on the image
- VISUAL: generates a patch with the colorimetry of the chart on the image, to estimate its visual difference, if the error is low, this estimate will be difficult to perceive.